Eval Tables help you compare model outputs, scores, and metrics across runs at the individual-example level. Use an Eval Table to compare model versions or training steps, review aggregate scores, and investigate the examples behind changes in model performance. The following image shows an Eval Table called "validation_prediction_eval" that compares two runs "summer-butterfly-9" and "gentle-flower-8":
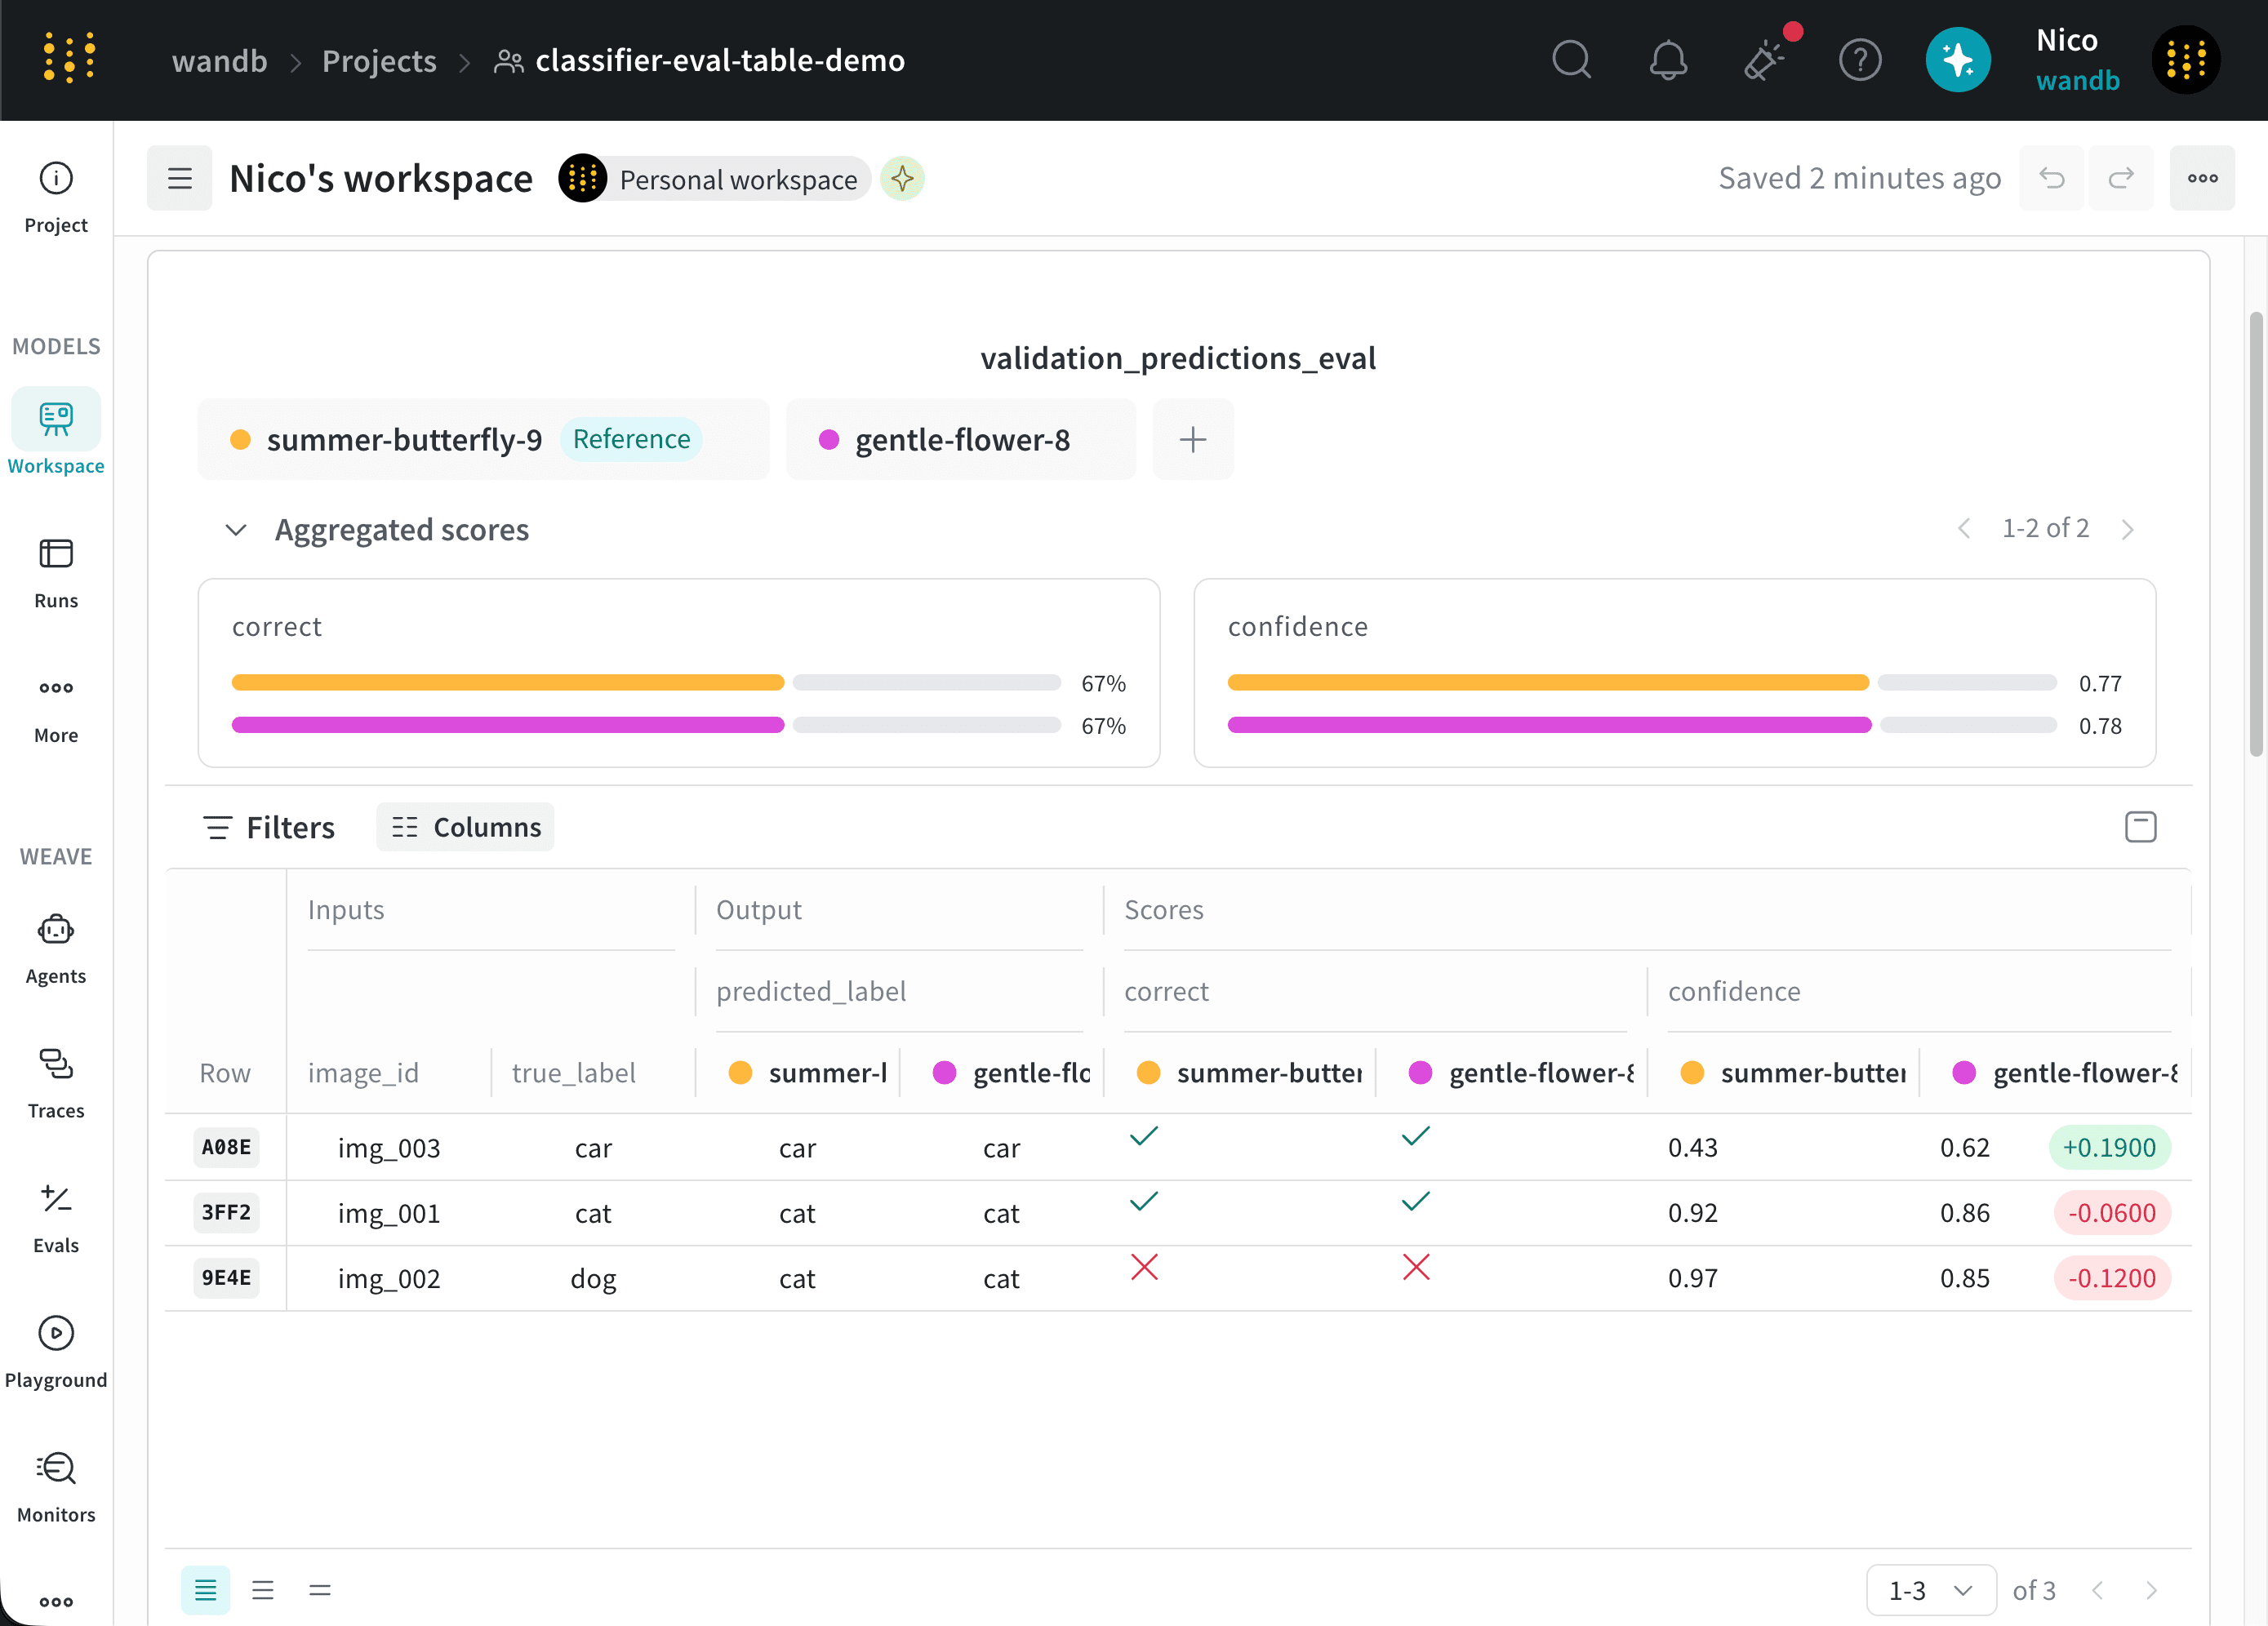
Evaluation table view
An Eval Table panel contains three sections:
  1. Run comparison selector: Select the runs that you want to compare.
  2. Aggregate scores: Review aggregate scores for the selected runs and compare the differences between them. For more information, see View aggregate scores.
  3. Dataset: Compare the inputs, outputs, and scores for each example across the selected runs.
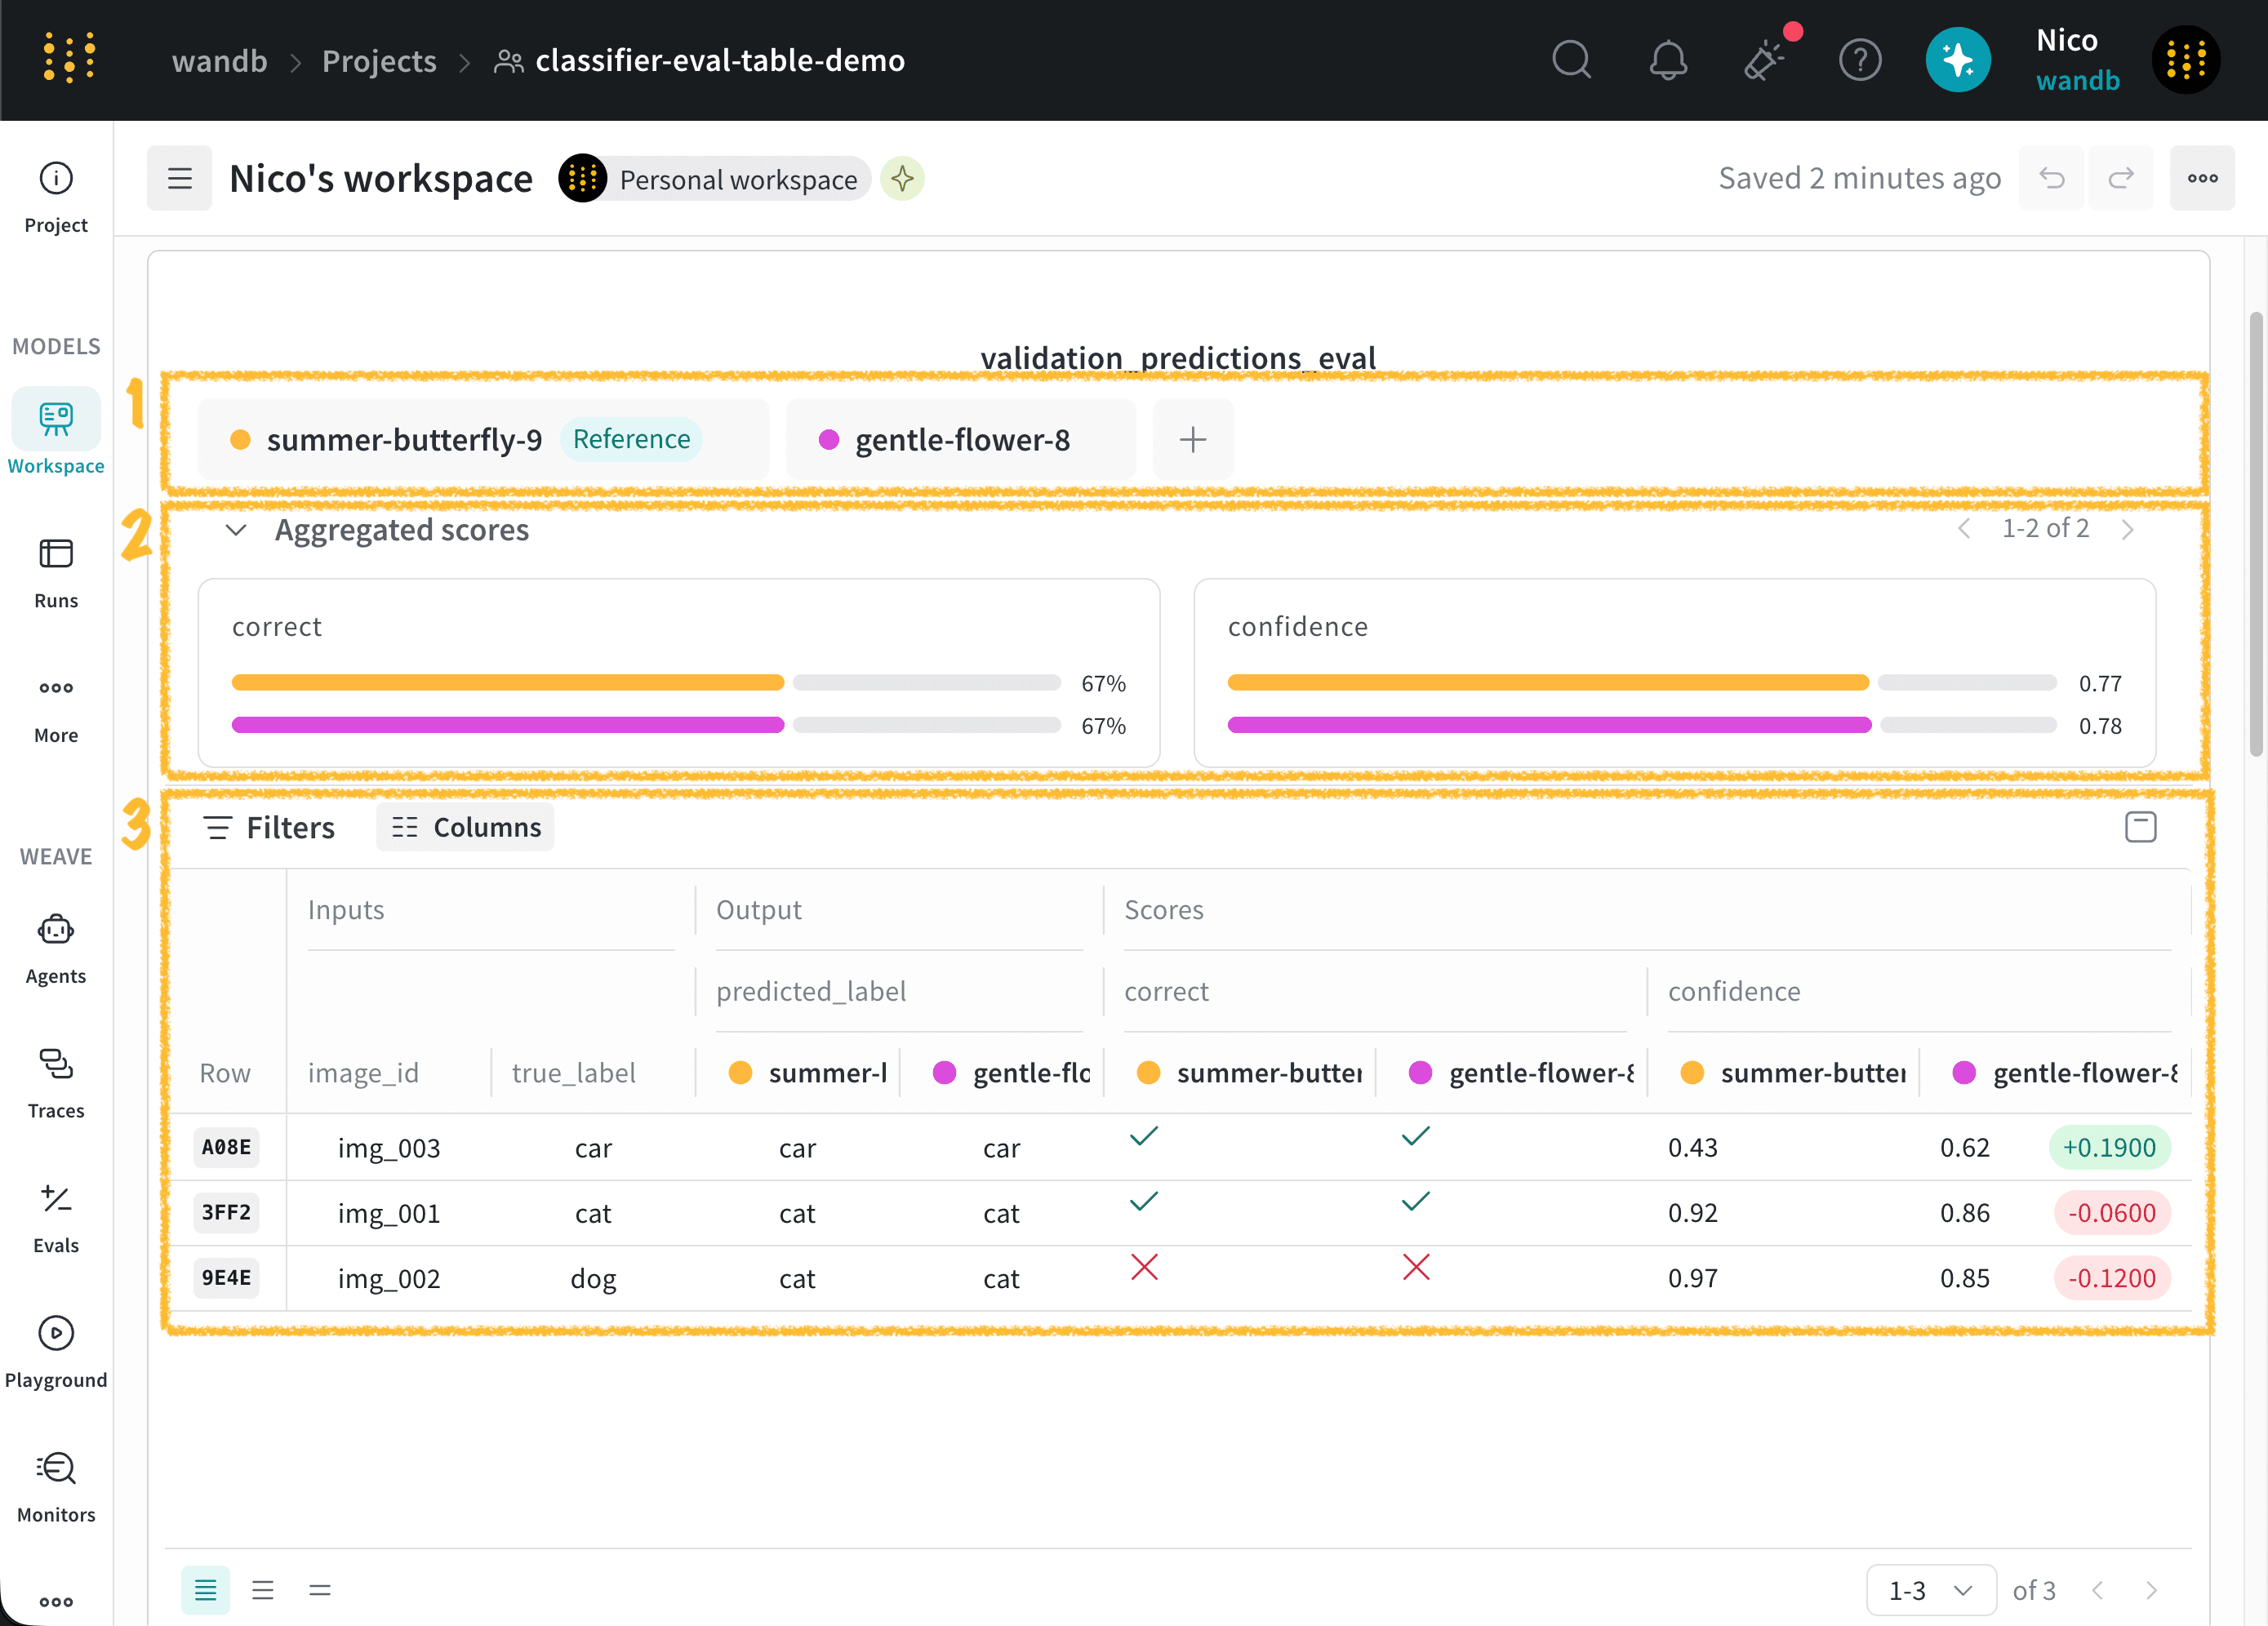
The following image highlights each section of the panel:
Evaluation table view
Create an Eval Table with the EvalTable class from the W&B Python SDK. You can also convert an existing W&B Table to an Eval Table.
Convert existing W&B Tables to Eval Tables to improve rendering performance and access additional comparison features. For instructions, see Convert a W&B Table to an Eval Table.
To create your first Eval Table, see Create an evaluation table.