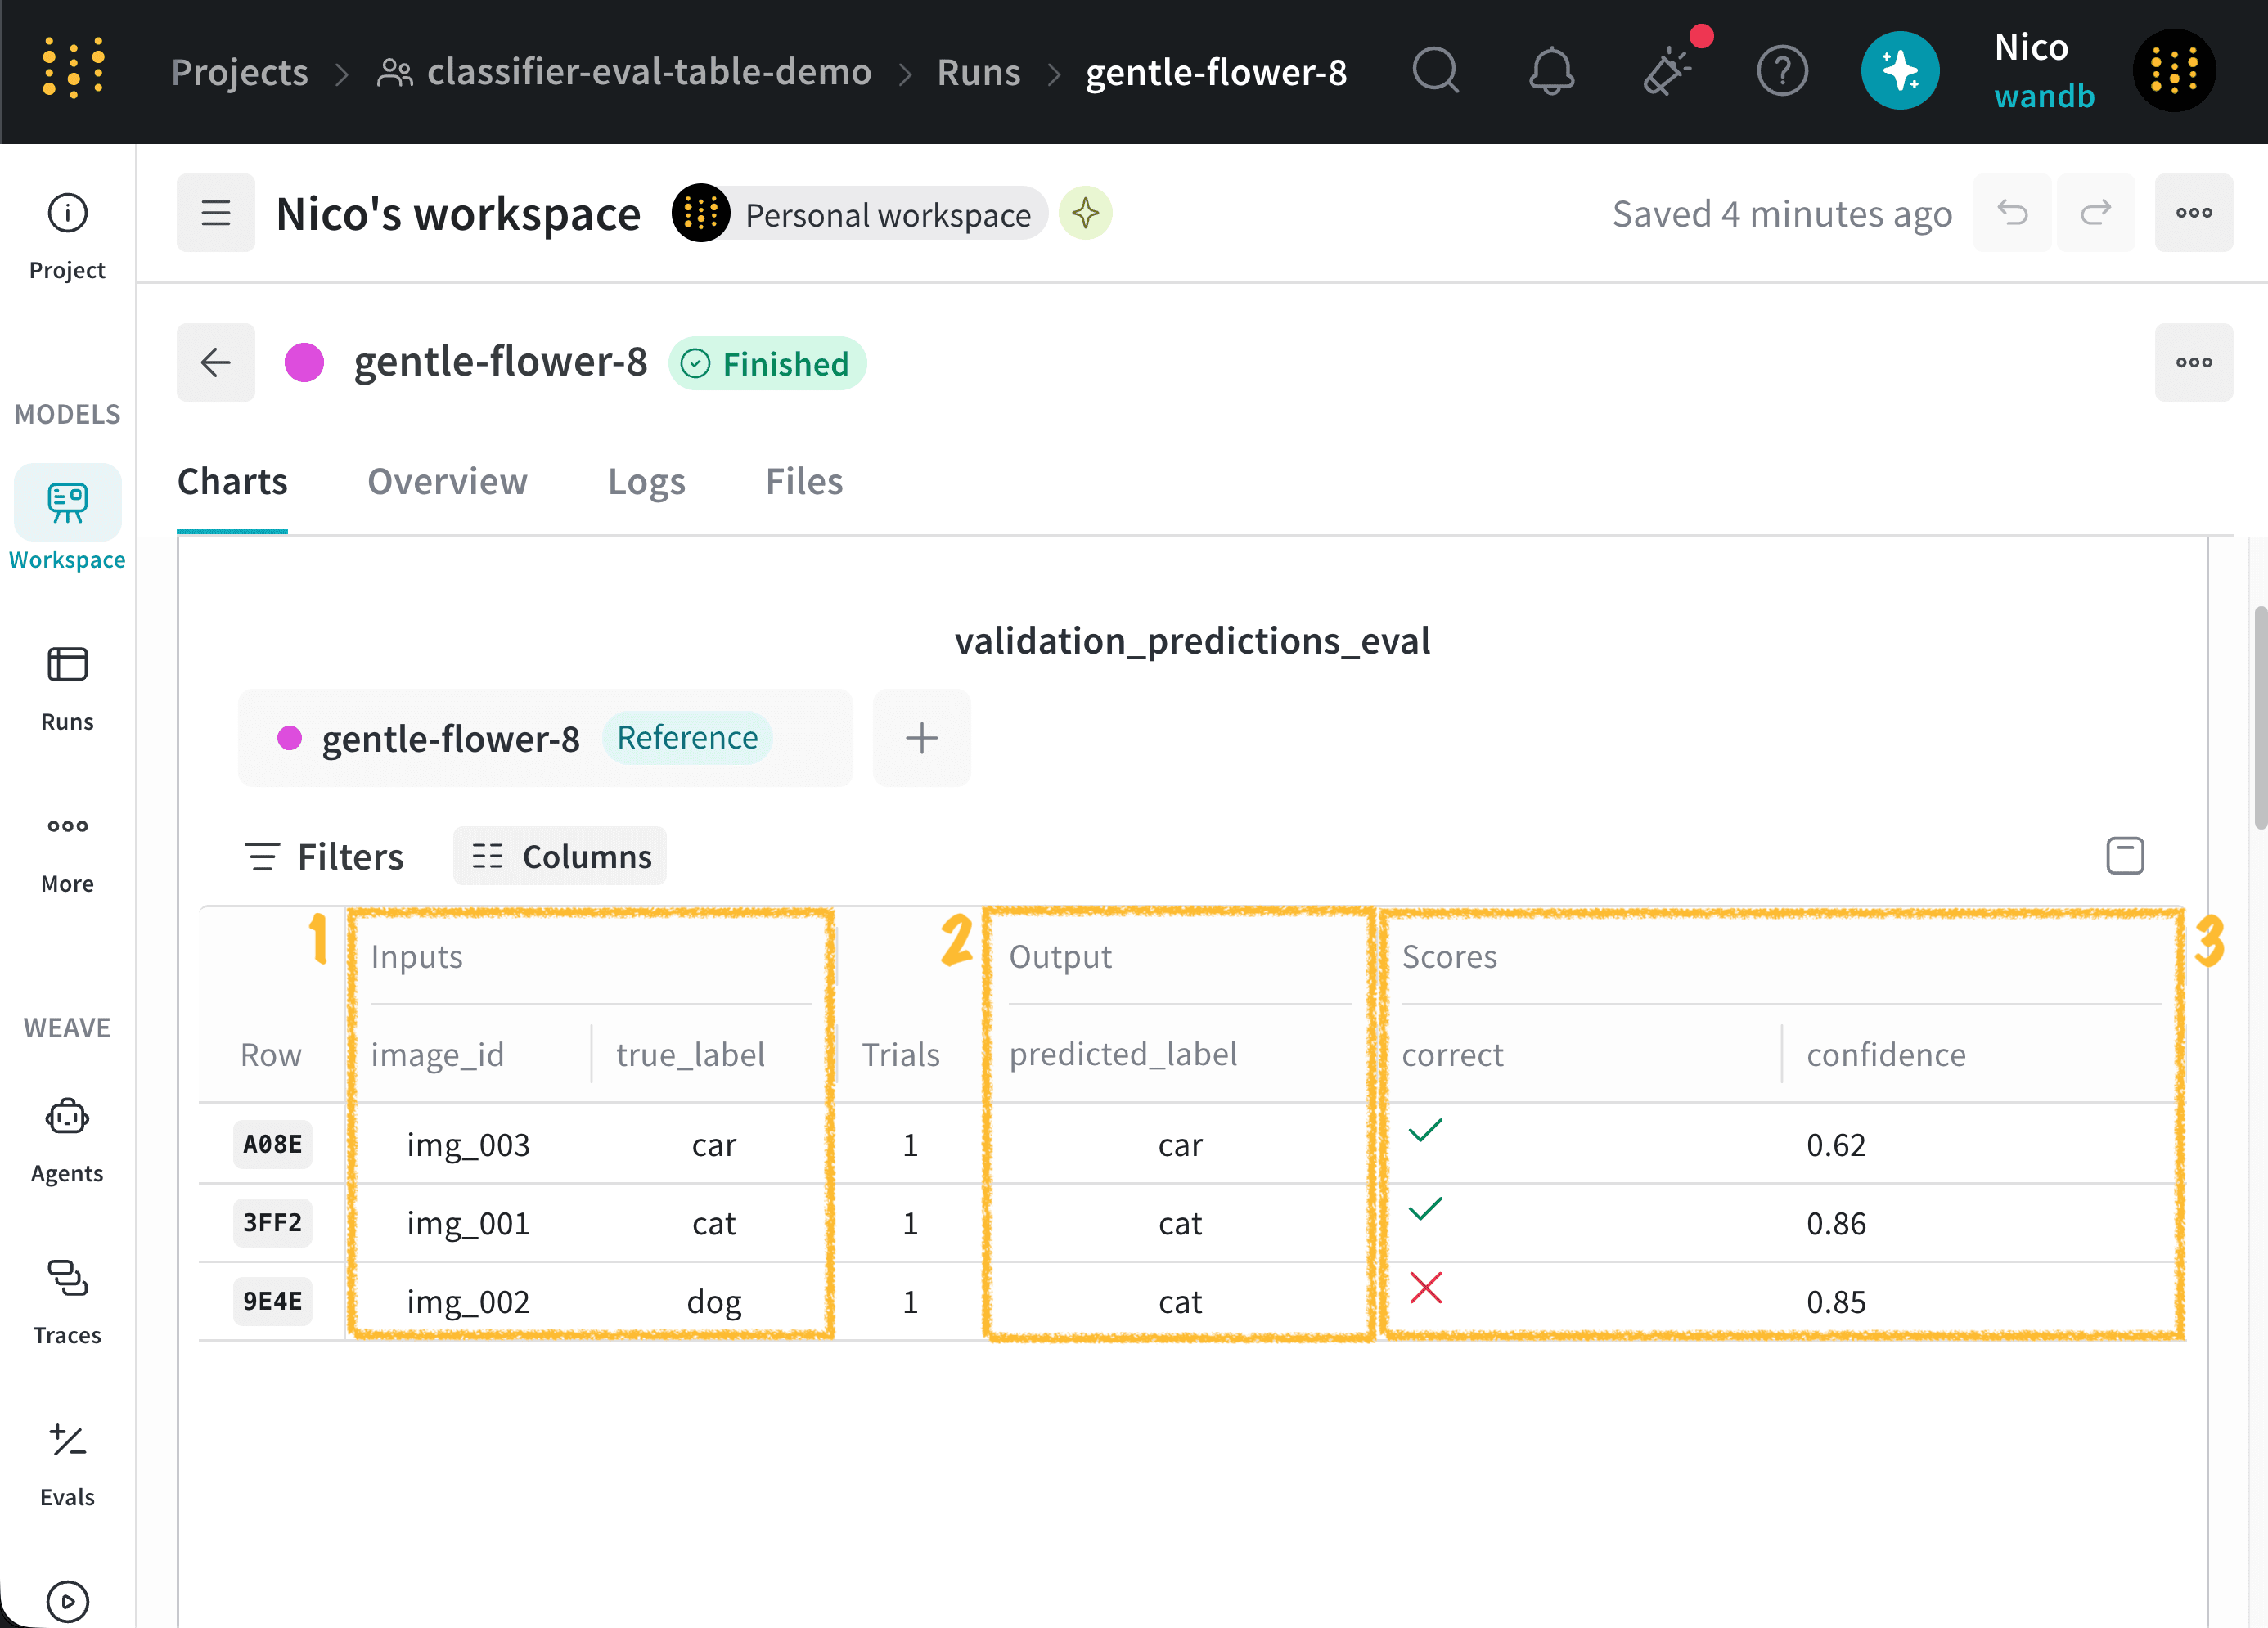
input_columns: Data provided to the model, such as an image, prompt, or ground-truth label.output_columns: Values produced by the model, such as a prediction or generated response.score_columns: Metrics or other values used to evaluate the output.
The examples on this page use code from Create an evaluation table. Expand View code to view or copy the complete example.
View code
View code
- The Inputs section contains the
image_idandtrue_labelcolumns. - The Outputs section contains the
predicted_labelcolumn. - The Scores section contains the
correctandconfidencecolumns.
Detail view
Select a row to open a detailed view of that example. The detail view shows the example’s inputs, outputs, and scores. The following image shows the detail view for the first row in the Eval Table: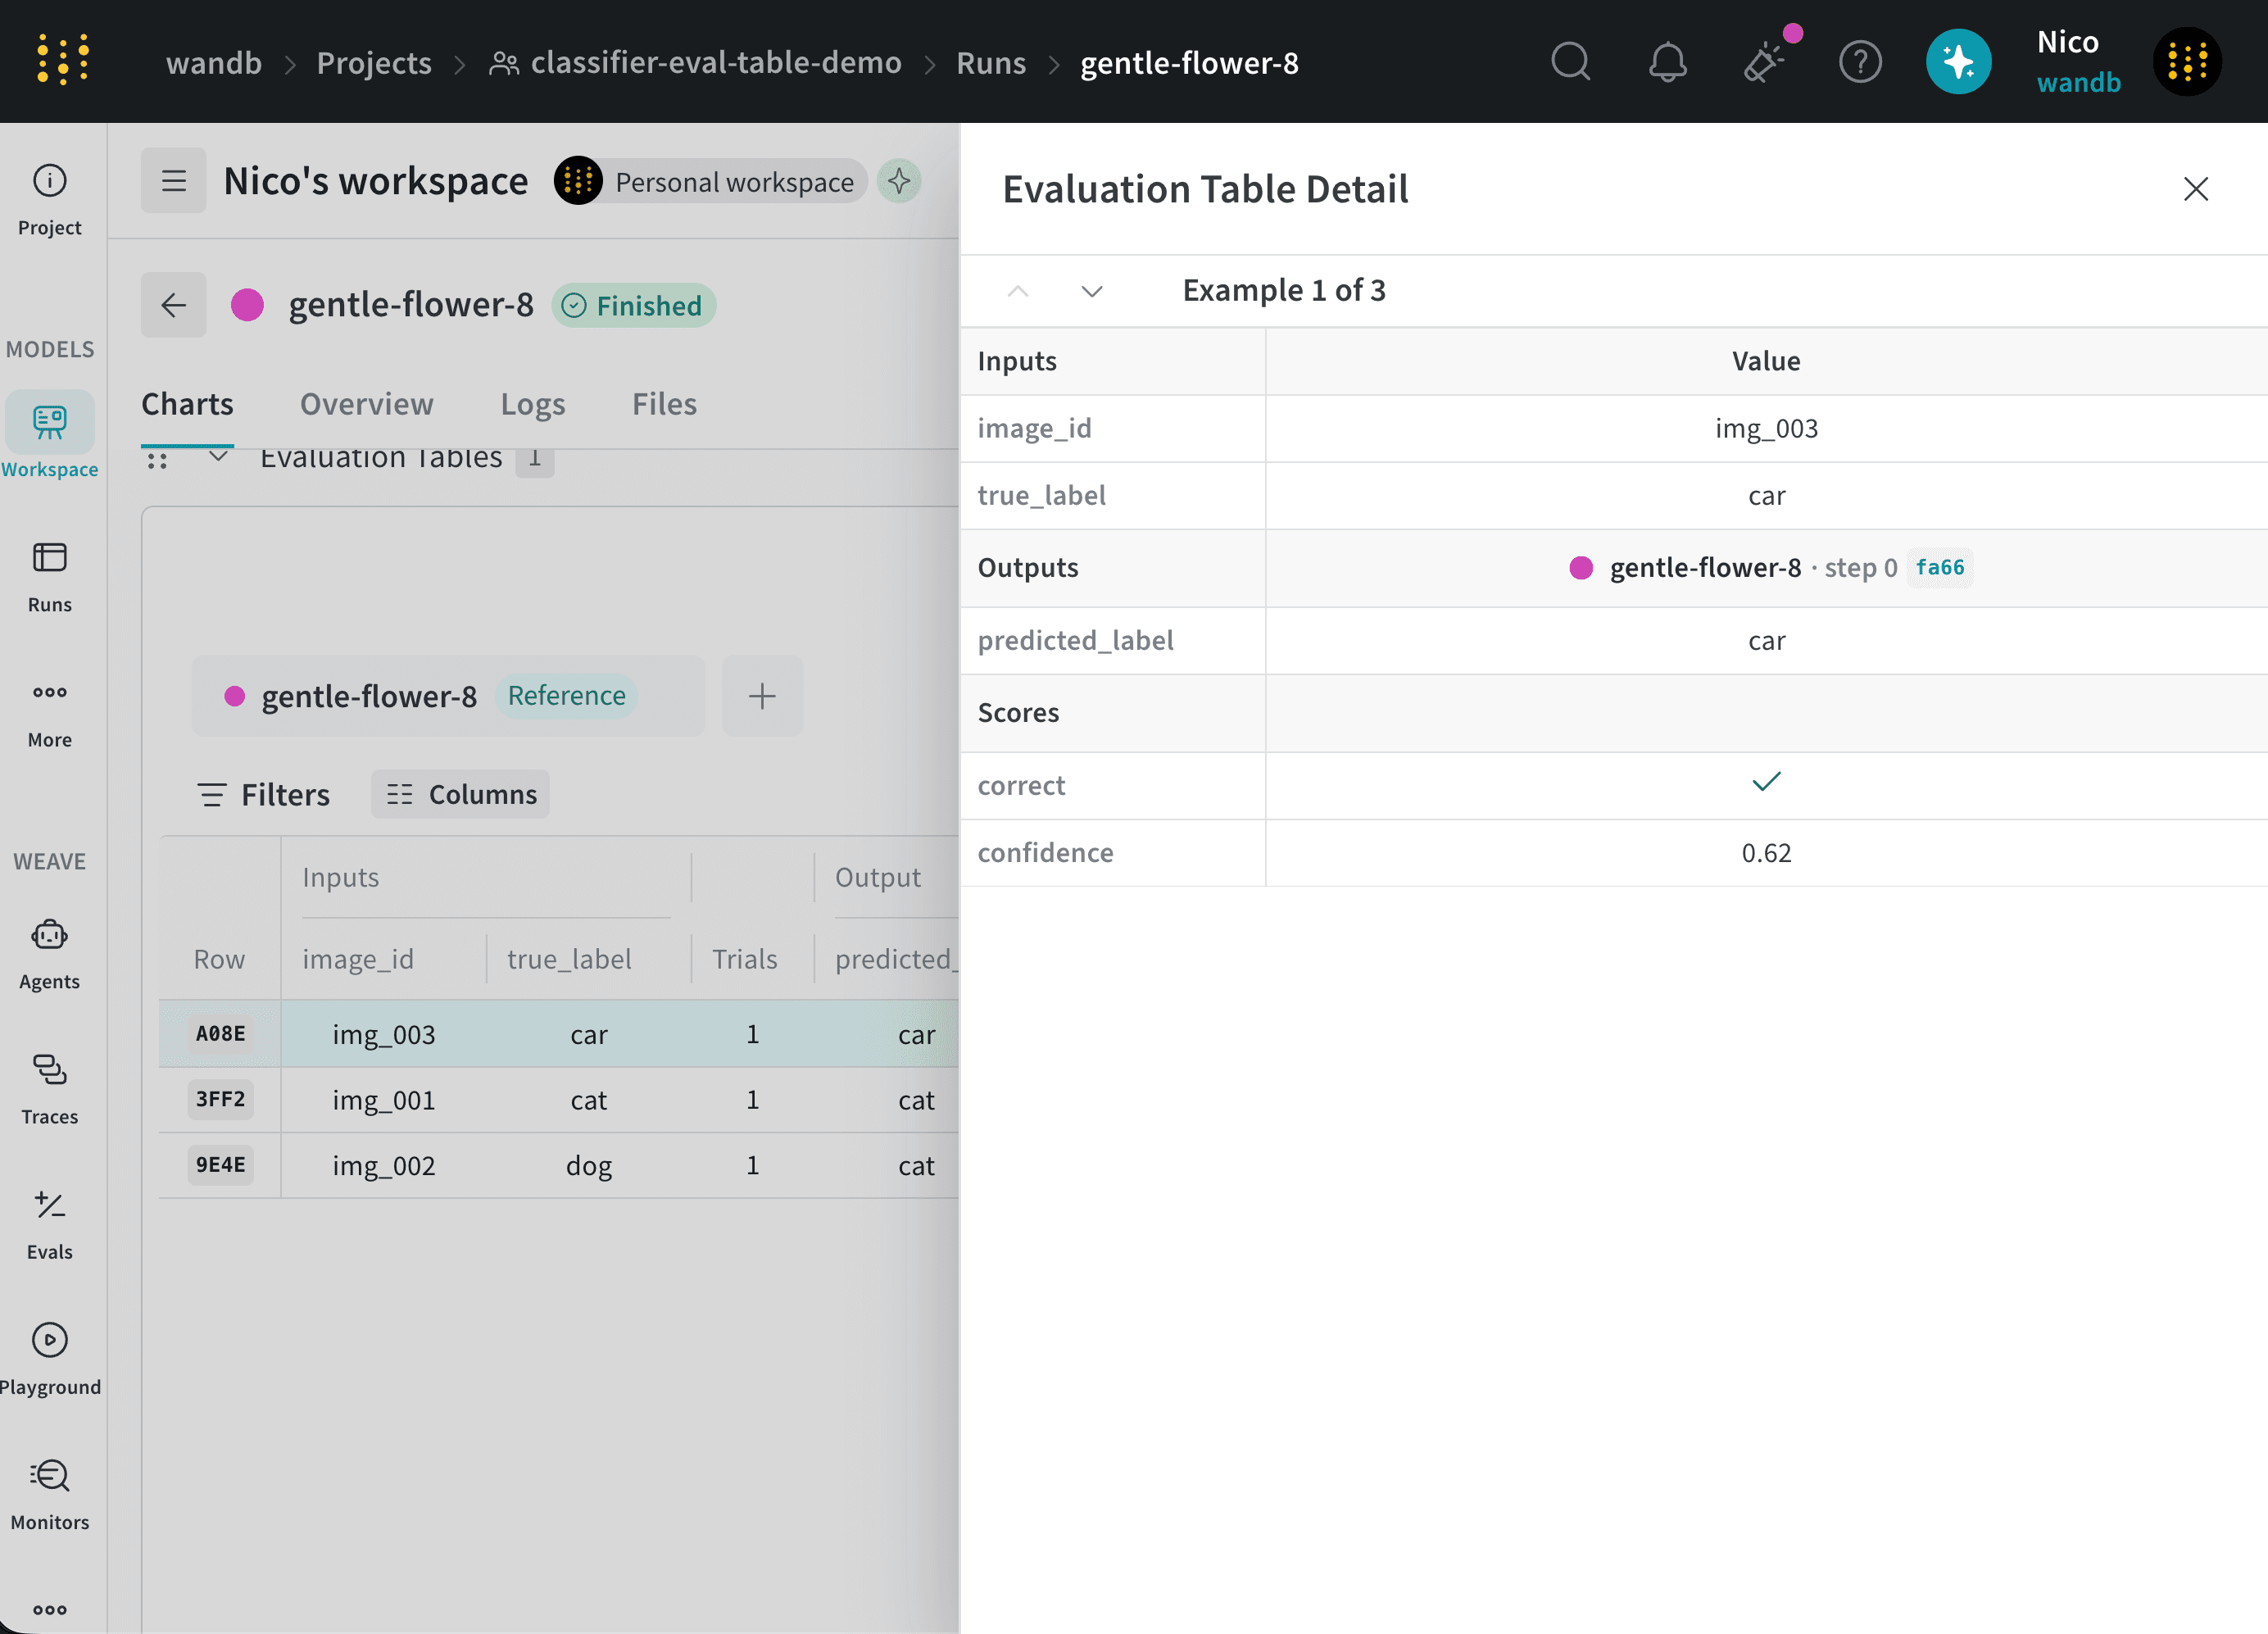
Filter data
Use filters to display only rows that match specific conditions. To add a filter: Select Filter above the table. Select the column to filter. Select an operator. Specify a value.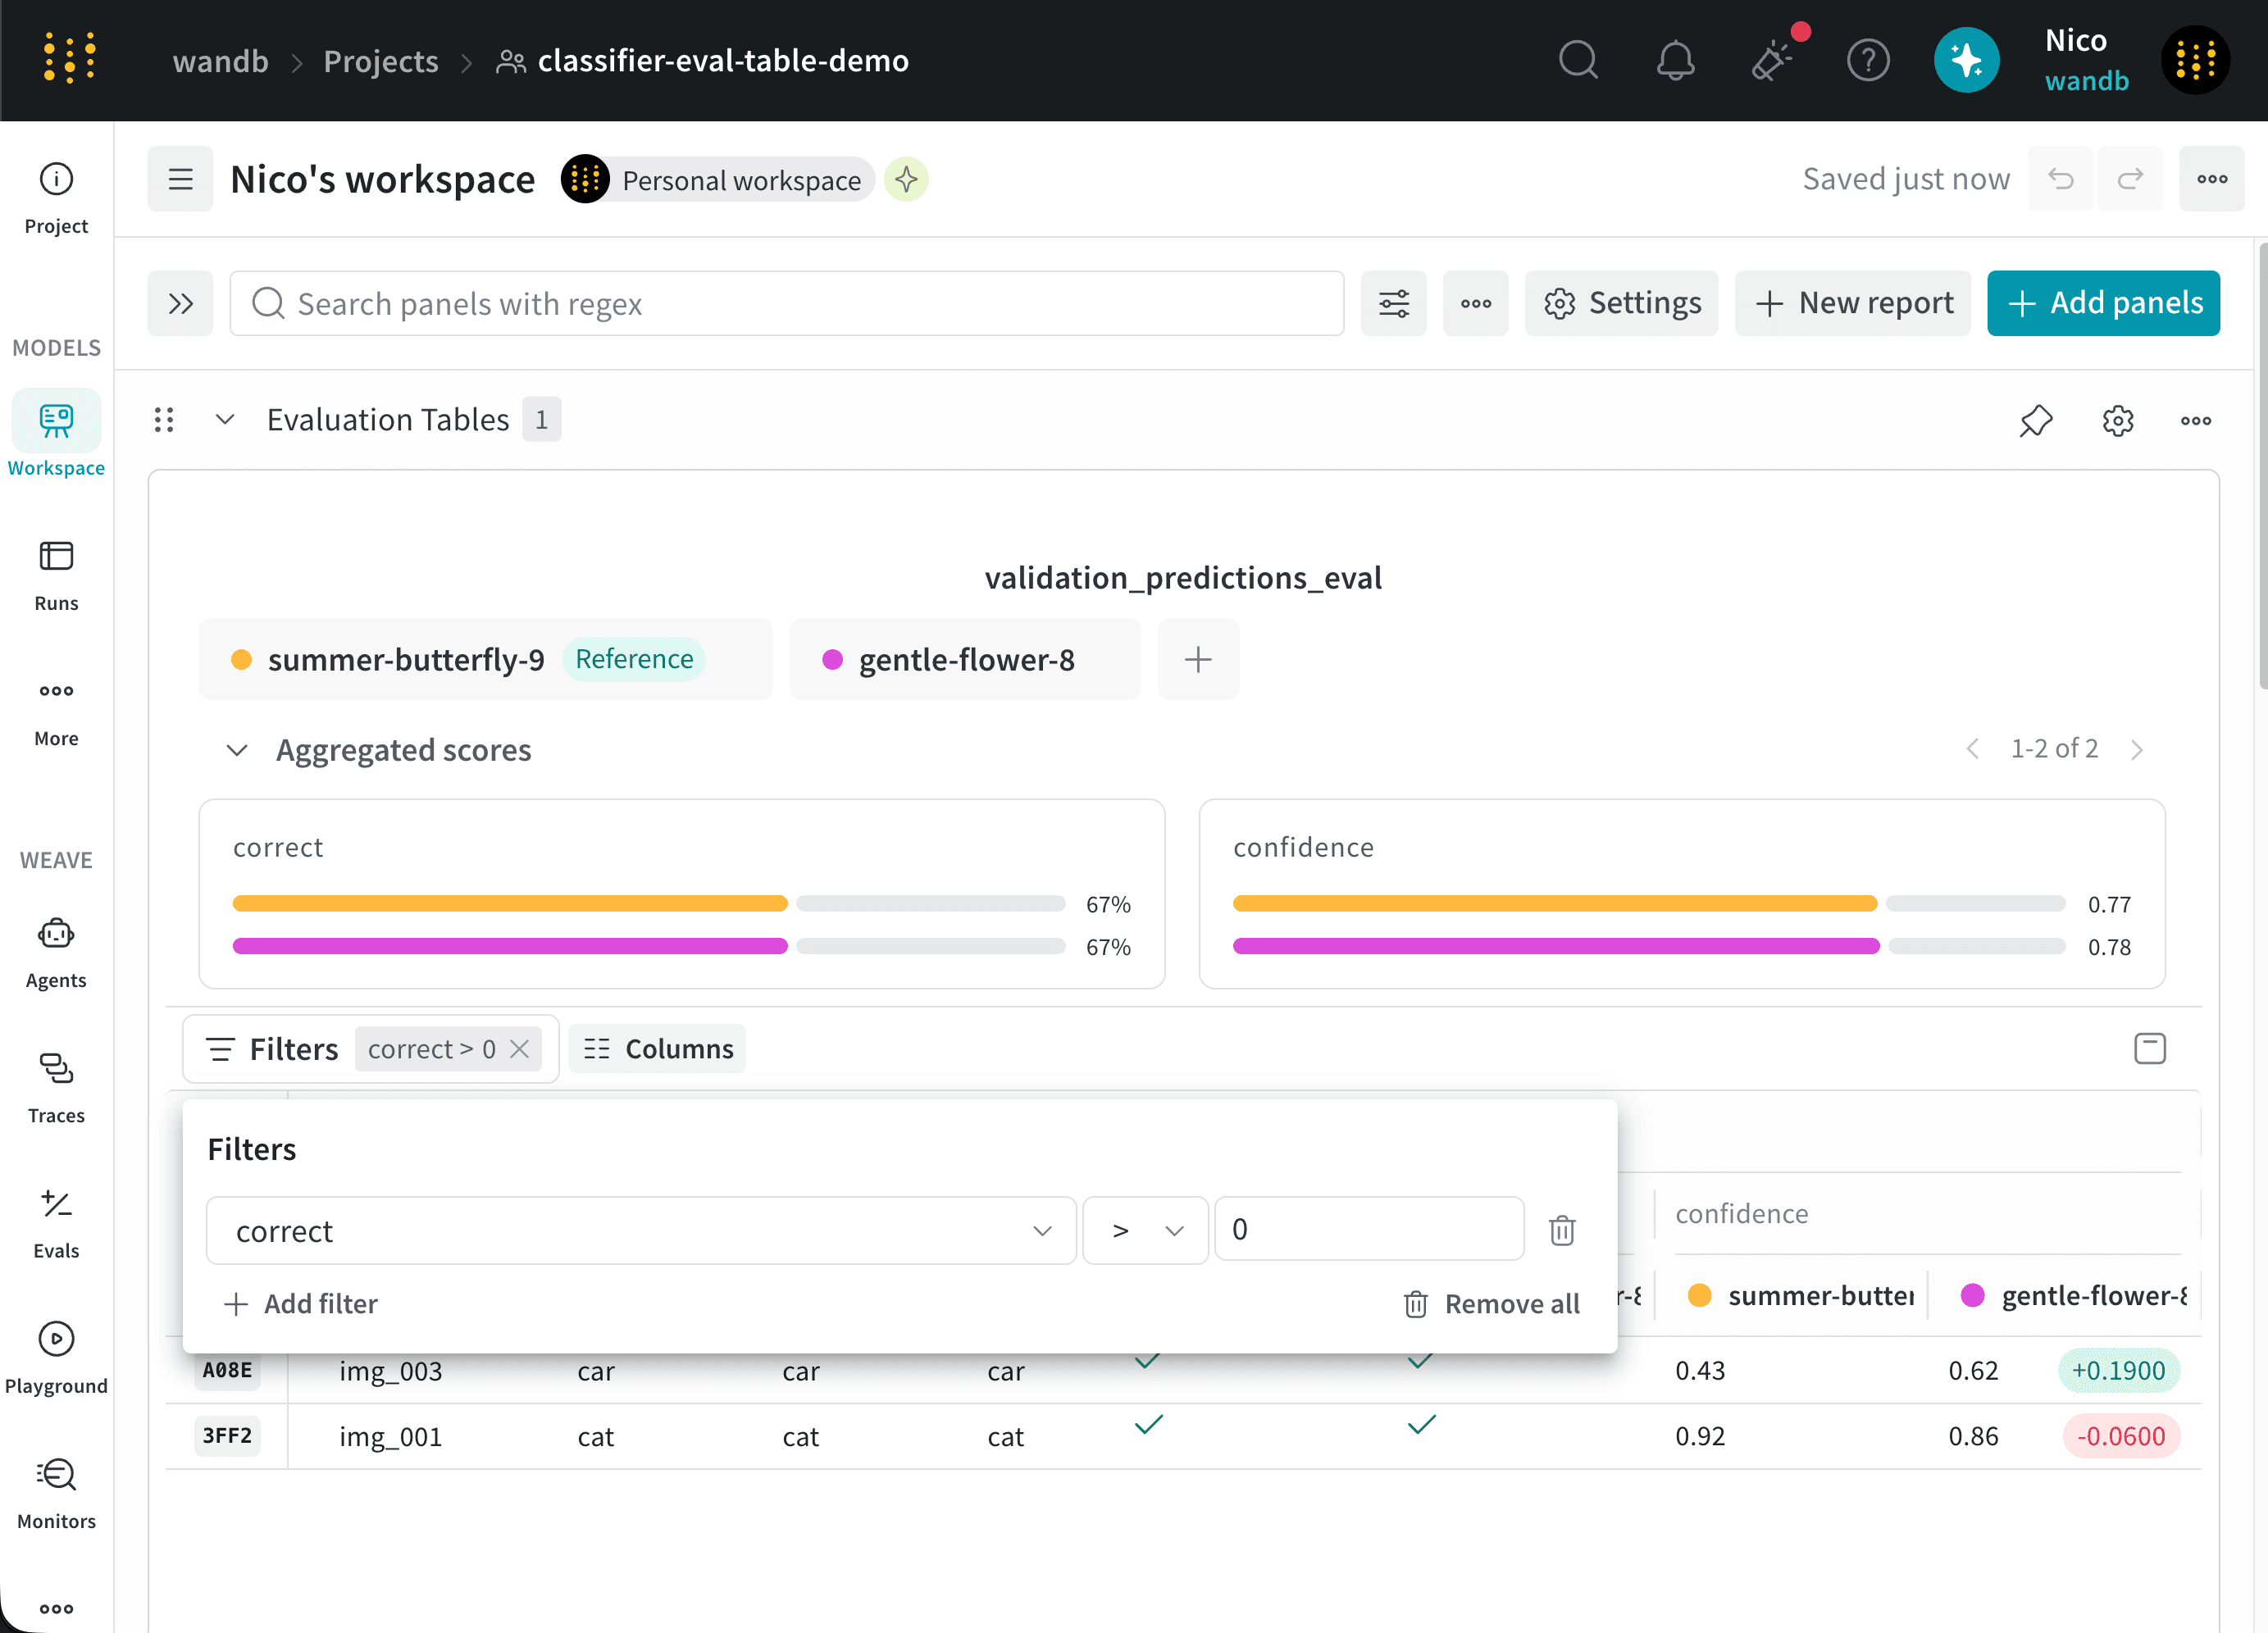
Show or hide columns
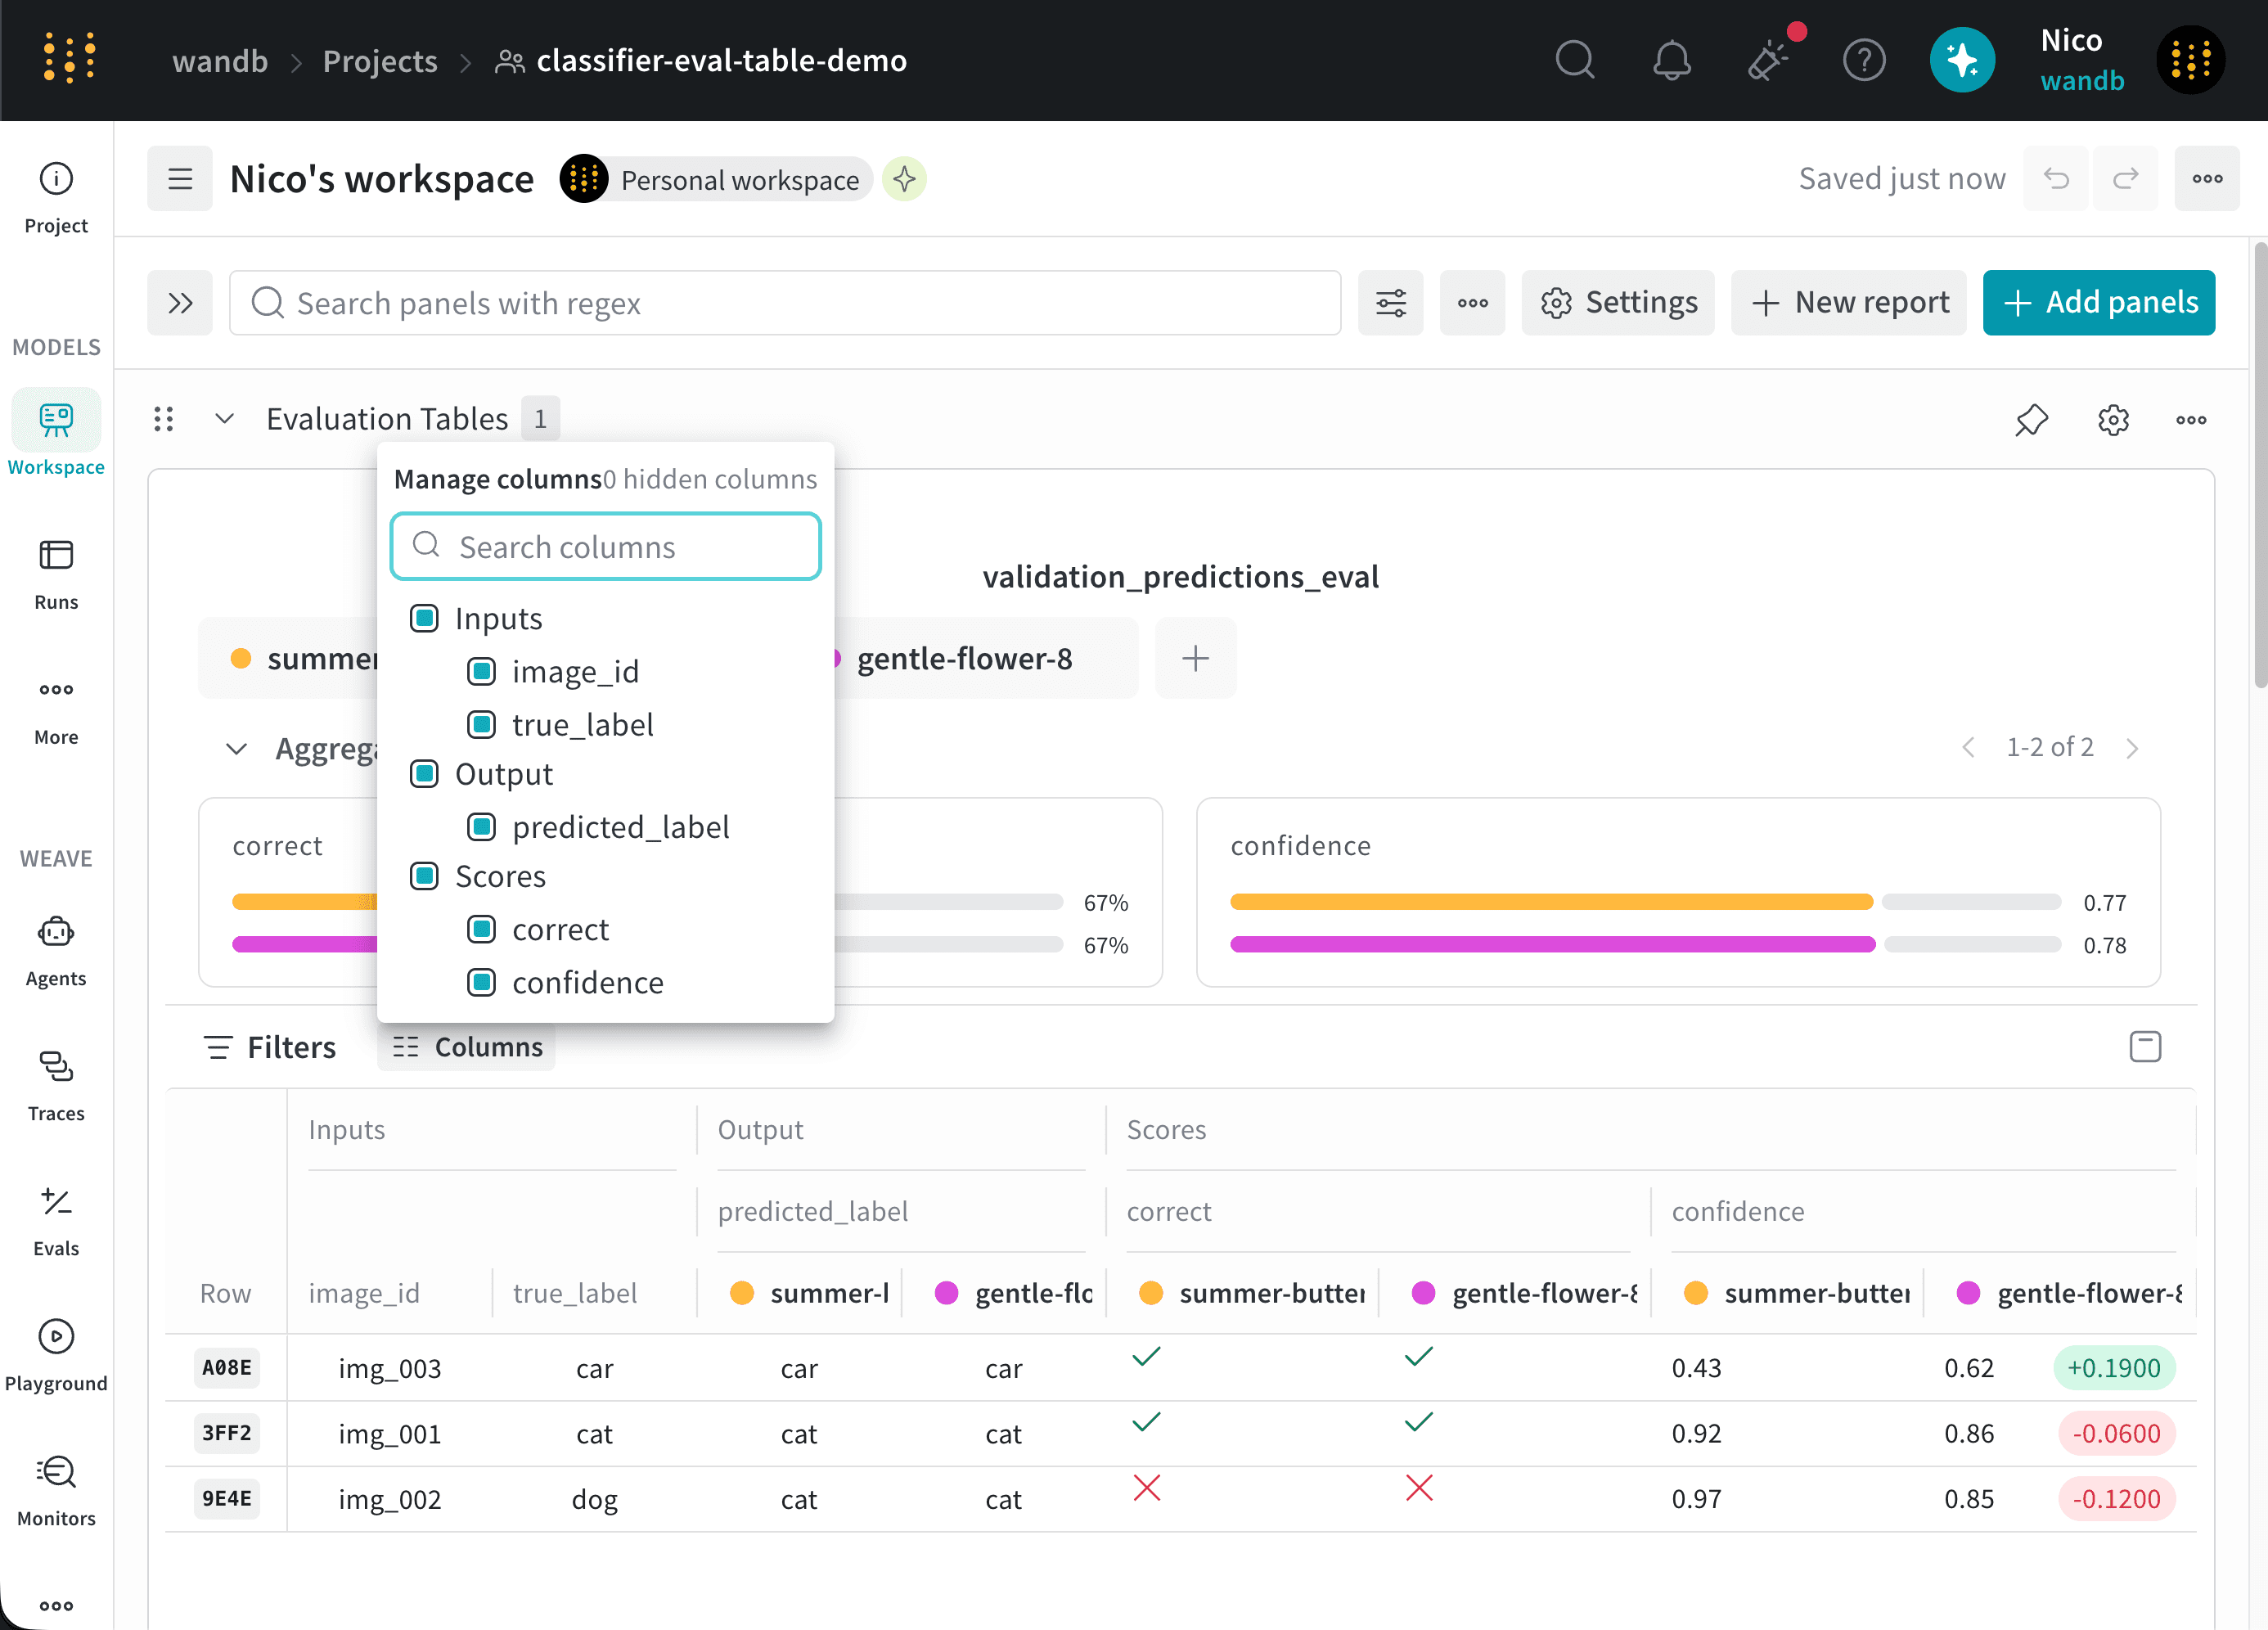
Use the Columns menu to control which columns appear in the Eval Table. The available columns depend on the data logged to the table. To show or hide a column:- Select Columns above the table.
- Select a column to show it, or clear the column to hide it.